

Experience Revolear
Explore our demos, discover our technology, get a quote, and meet our team—human and AI—in our Virtual Briefing Center.

The Problem. Deal desk teams often show up to the CFO or board with activity counts — deals processed, tickets closed, average response time — while the numbers that would actually change a pricing, staffing, or product decision never make it into the deck.
The Instinct That's Wrong. Believing a bigger dashboard signals more rigor, so every field the CRM can export gets reported instead of the handful of numbers tied directly to margin and revenue outcomes.
The Fix. Report five metrics that move money — cycle time, win rate, discount rate, margin, and leakage — on a fixed cadence, and add one consumption-specific line if the business runs on usage-based pricing.
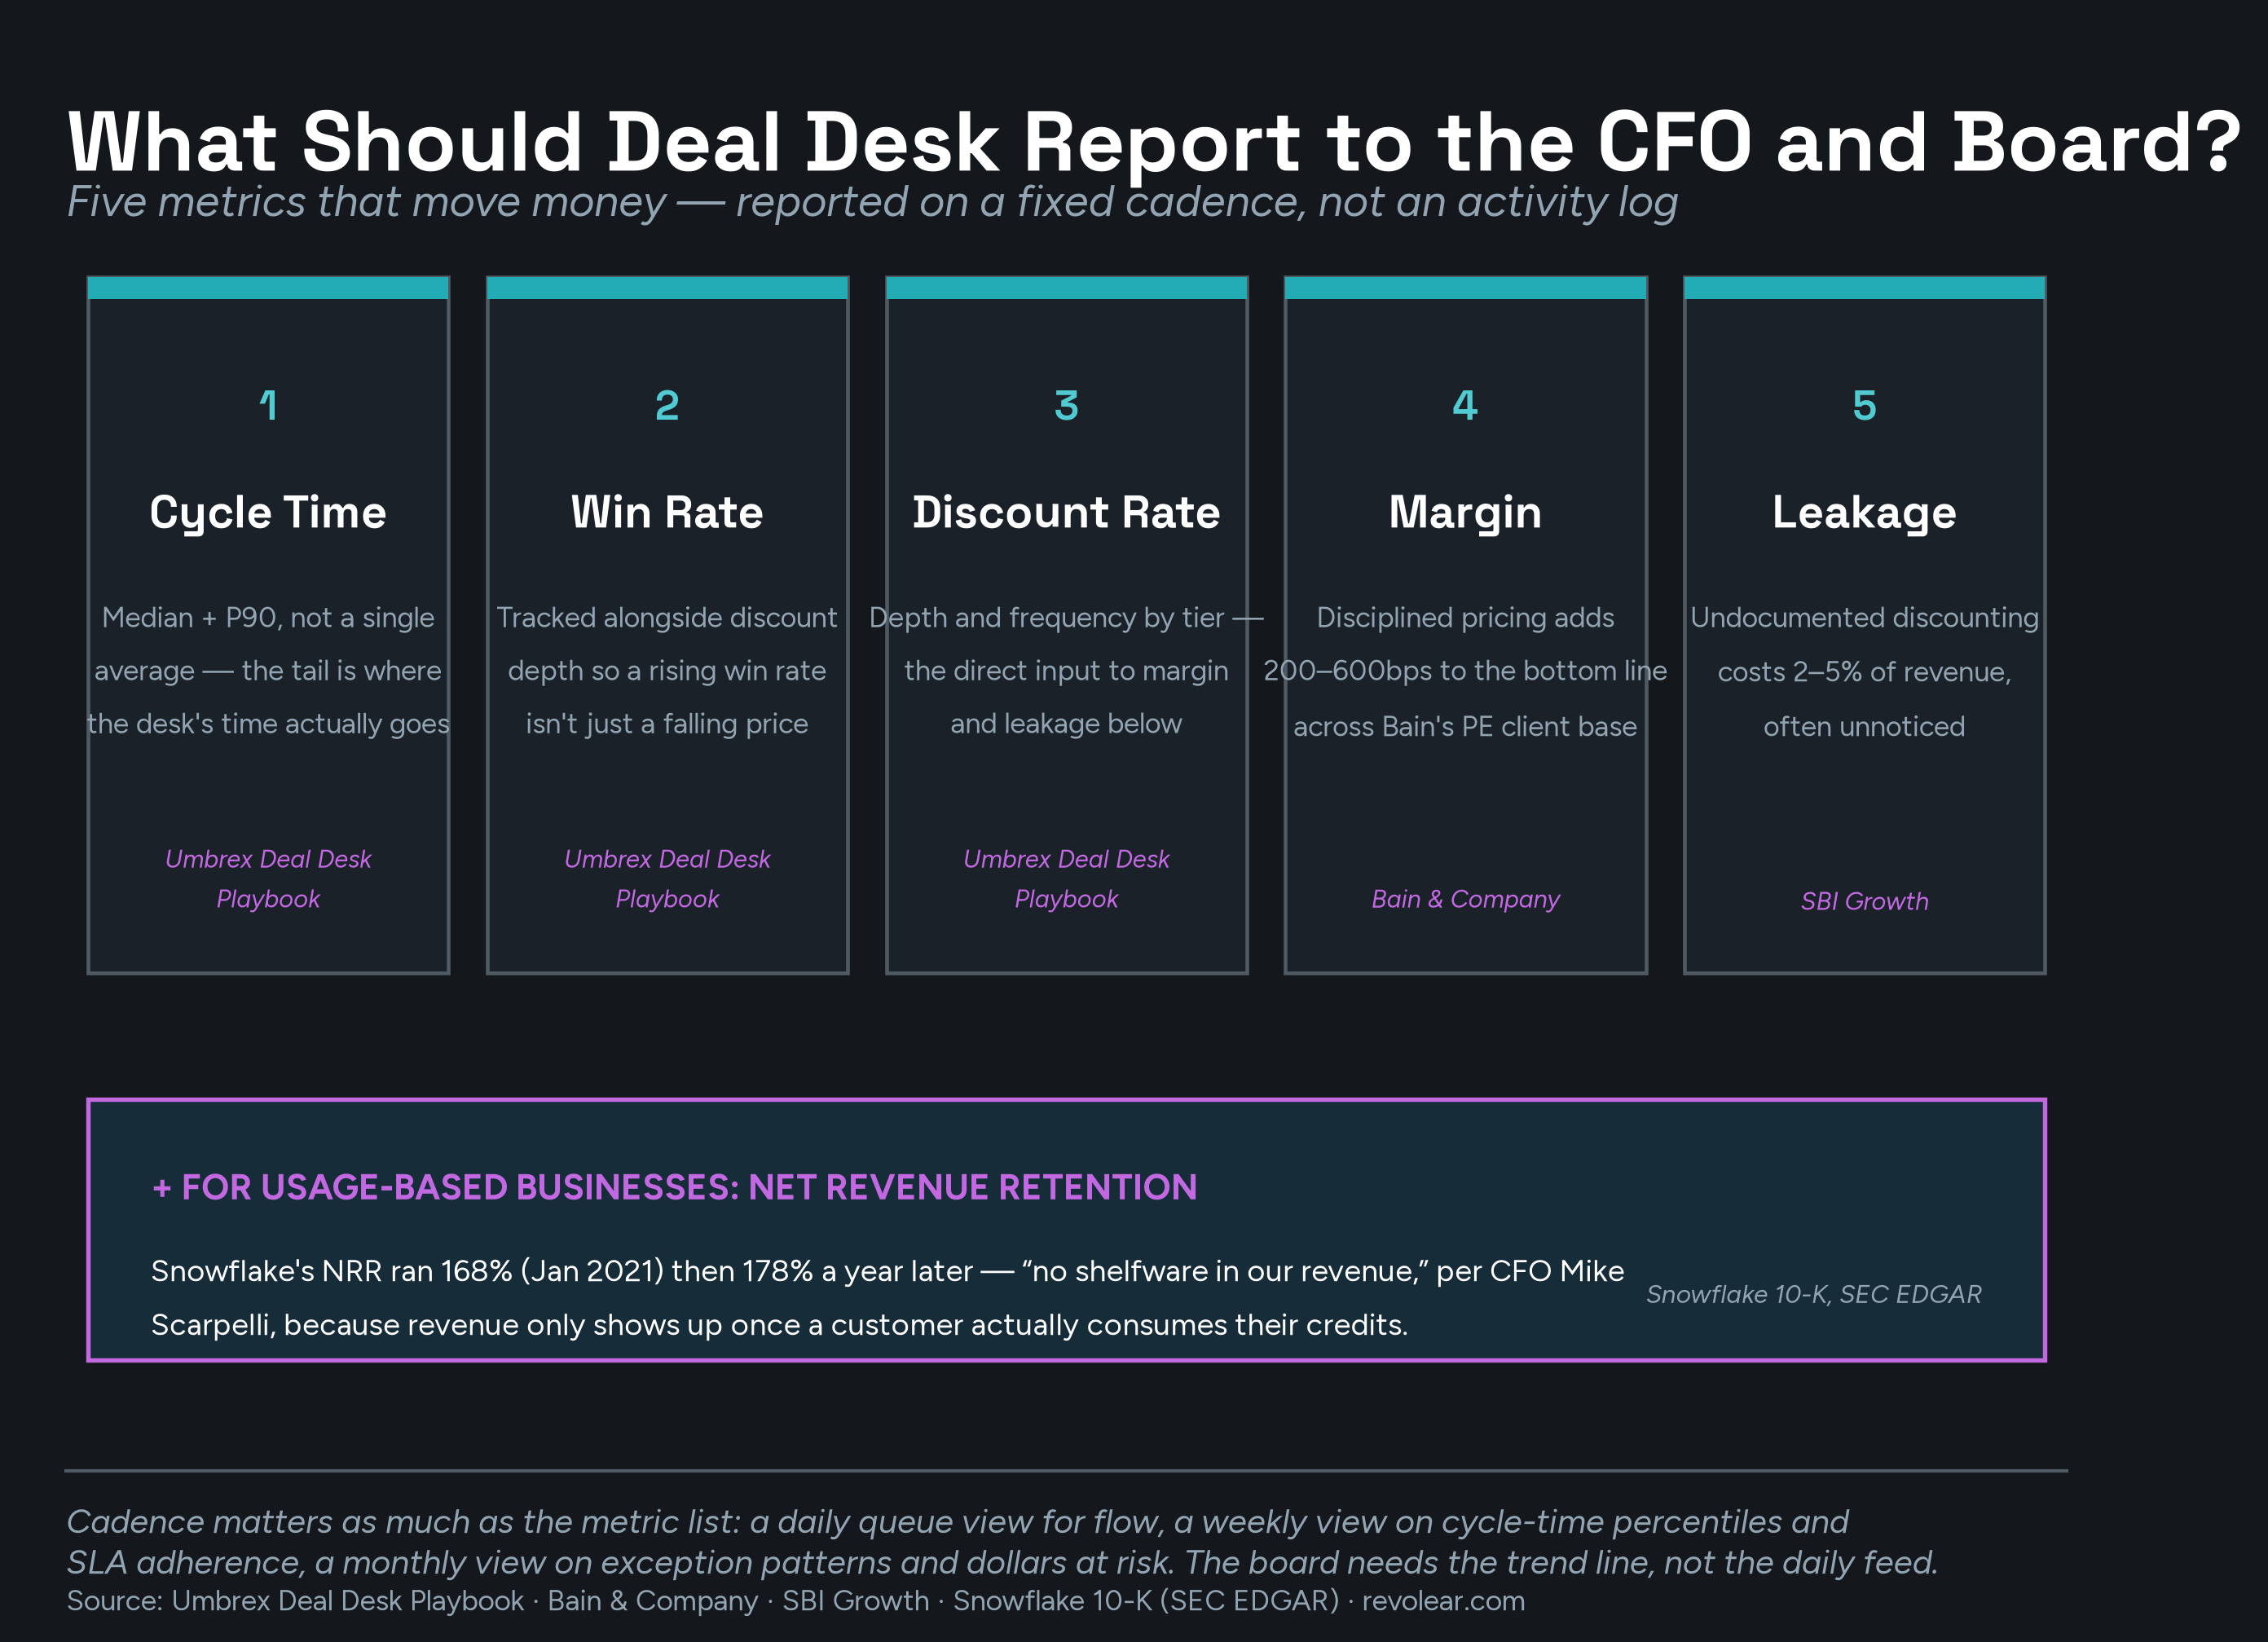
A deal desk that reports activity volume is answering a question nobody on the board is asking. The CFO wants to know whether pricing discipline is holding as the company scales; the board wants to know whether the growth engine is efficient. Neither question gets answered by "we touched 340 deals this quarter" — they get answered by a small, consistent set of numbers reported the same way every time.
The clearest framing of what belongs on that scoreboard comes from the Umbrex Deal Desk Playbook, an unattributed but detailed practitioner resource: "Five KPIs cover the territory: cycle time, win rate, discount rate, margin, and leakage" (Umbrex Deal Desk Playbook). Treat it as a useful organizing framework rather than a named-firm research finding, but the underlying logic holds up against primary research. On cycle time specifically, the playbook recommends reporting a median and a 90th percentile rather than a single average — a median hides exactly the tail cases (the multi-stakeholder enterprise deal stuck in legal review) that actually consume a desk's time. GitLab's own published KPI table, covered in Spoke 7 of this series, is the real-world proxy for what that reporting looks like in practice: a named, NASDAQ-listed company tracking Case Resolution and Opportunity Approval SLAs quarter over quarter and publishing both the target and the actual result.
Margin and leakage carry the highest financial weight of the five. SBI Growth puts a number on the blind spot: "leakage can cost 2–5% of revenue, often unnoticed" (SBI Growth). Bain's research across its private equity client base found that disciplined pricing and deal-governance capability "can add 200 to 600 basis points to a company's bottom line" (Bain & Company), and Bain's Dynamic Deal Guidance practice cites a client result of $25–40 million in margin uplift over three years, with 95% utilization across the commercial team within nine months (Bain & Company). McKinsey's research points the same direction: one company's weekly, customer-level pricing dashboards identified more than $25 million in margin-improvement opportunities in a single pilot business unit (McKinsey & Company), and a separate McKinsey study of dynamic deal-scoring found companies improving return on sales 2–7% within 12 to 18 months once discounting decisions were guided by real-time recommendations rather than rep judgment alone (McKinsey & Company). None of this is deal-desk-specific research — it's pricing-capability research — but a deal desk is the operational mechanism that puts that capability into practice on every order form, which is why these numbers belong in the reporting package.
The same Umbrex framework is worth taking seriously here: "dashboards should serve routines, not curiosity," tying reporting to three cadences — a daily queue view for flow management, a weekly view on cycle-time percentiles and SLA adherence, and a monthly view on exception patterns and dollars at risk (Umbrex Deal Desk Playbook). The board doesn't need the daily view — it needs the monthly or quarterly roll-up, framed the way GitLab frames its own KPI reporting: target versus actual, by category, over time. A single quarter's numbers tell you little; the trend line is what earns the desk more headcount or system investment at the next budget cycle.
Consumption pricing adds a reporting line that subscription businesses don't need. Snowflake's own 10-K describes the mechanism directly: "we provide our platform through a customer-centric, consumption-based business model, only charging customers for the resources they use," and its net revenue retention rate — the metric most sensitive to whether existing customers are actually consuming more over time — was 168% as of January 31, 2021, and 178% a year later (Snowflake 10-K, SEC EDGAR). On the Q3 FY21 earnings call, CFO Mike Scarpelli put the reporting implication plainly: because revenue only shows up once a customer consumes their credits, "there is no shelfware in our revenue" — a very different signal from a subscription business's booked-and-recognized ARR. Bessemer Venture Partners' benchmarking across hundreds of cloud companies found gross retention "relatively consistent at 85-90%" regardless of pricing model, while net retention runs an average of 140% between $1–10 million of ARR, moderating to roughly 120% by $10–100 million-plus (Bessemer Venture Partners) — the gap between gross and net retention is expansion revenue, and for a usage-based business that expansion is exactly what a deal desk's commit-and-overage structuring either protects or erodes.
That makes overage and true-up handling a reporting line in its own right, not just a contract-drafting question. SBI Growth's 2025 State of SaaS Pricing Report found 24% of companies still route customers to a human touchpoint when they exceed usage limits — a sign, the report notes, that "companies lack data-driven escalation frameworks" (SBI Growth) — and that 24% is a queue a deal desk should track and try to shrink, the same way it tracks cycle time. The same report states the stakes for the desk itself: "by $50 million in revenue, companies should have a deal desk. At $500 million, not having one puts you in a tiny minority," and companies with one are "at least 20% more likely to meet or exceed growth goals" (SBI Growth). Andreessen Horowitz's guidance on usage-based design — credit rollover and draw-down, true-up reconciliation, in-product usage dashboards — describes exactly the mechanics a deal desk should report by exception: how often true-ups exceed the committed amount, how often rollover caps get hit, how often a customer's usage forecast diverges from contract (a16z, Tugce Erten and Mark Regan; a16z).
Revolear sets up dozens of new Order Forms every quarter for usage-based businesses and assists our customers' sellers in the mechanics of setting up these deals. The desks that earn a permanent seat at the QBR are the ones that show up with five numbers and a trend line — not a screenshot of every field the CRM happens to track.
Report cycle time, win rate, discount rate, margin, and leakage — median and P90 where it matters, on a fixed monthly or quarterly cadence, not as a running activity log. If the business is usage-based, add a sixth line for consumption health: net revenue retention, overage frequency, and true-up variance. That's the version of the deck that changes a headcount decision, not just fills a slide.
Related in this series: this post is part of Revolear's Deal Desk Handbook. Read more from the series:
What a Deal Desk Actually Does (and Why Most Companies Eventually Build One) — read the pillar post
When Should a Growing Company Build a Deal Desk Function? — read the post
What Turnaround-Time SLA Should Deal Desk Commit To? — read the post
The Full Remit: What Else a Mature Deal Desk Owns — read the post
The Deal Desk Glossary — read the capstone

Explore our demos, discover our technology, get a quote, and meet our team—human and AI—in our Virtual Briefing Center.
548 Market St, Suite 69725
San Francisco, CA 94104.

